
Part I. How do you know? Chapter three.
Peas Owe the Table Nothing
Contents of Grounds
In Dana’s notebook there is a square of four cells — the combination table familiar from biology lessons. Beside it stands written: “Three to one”. Cross two plants, each carrying the hereditary factors for both smooth and wrinkled seeds, and the teaching scheme gives exactly this ratio: three smooth to one wrinkled.
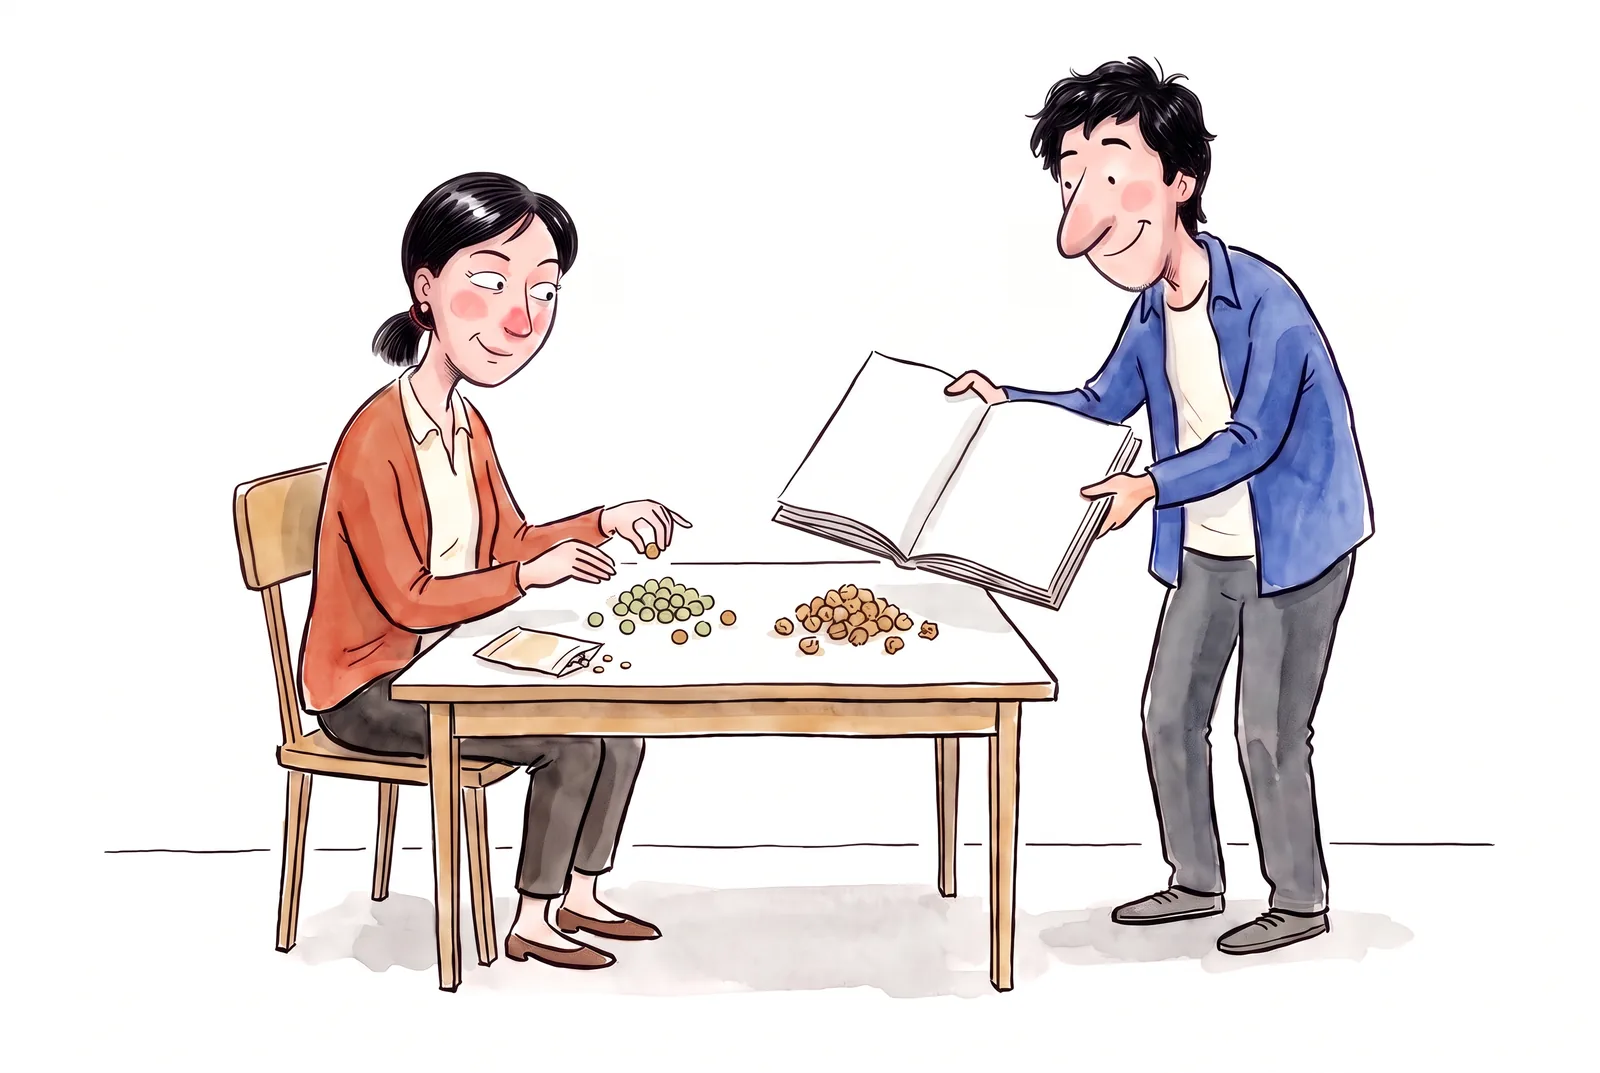
On the table lie twenty seeds from a garden plot. By the description, they come from such hybrid plants. Dana sorts the peas into two piles: thirteen smooth seeds in one, seven wrinkled in the other.
“There should be fifteen and five,” says Timur. “Unless the peas never read the textbook.”
Before reading on, decide: is the table wrong, is something off with the peas, or are we asking too much of them?
What the table lists
First, let us sort out the four cells. Call the two variants of the hereditary factor A and a. In our scheme each parent carries both variants and passes one of them to the offspring. One variant arrives from the second parent too. Here are the pairs that can result:
| A from the second parent | a from the second parent | |
|---|---|---|
| A from the first parent | AA — smooth seed | Aa — smooth seed |
| a from the first parent | aA — smooth seed | aa — wrinkled seed |
The pairs Aa and aA hold the same variants. They stand written apart here to show which parent each came from. Where A is present, the scheme makes the seed smooth; wrinkled it is under the aa match. So smooth seeds own three cells out of four. Their share is exactly three quarters.
So far we only counted cells. Counting them as equally likely takes conditions: each parent passes A and a with equal probabilities, and one parent’s pick does not depend on which variant came from the other. The trait must also show itself as the table describes. Under these conditions the probability of a smooth seed is 3/4.
Each cell shows a possible combination. The table sets no order in which the combinations must appear. It does not demand that three smooth seeds be followed by a wrinkled one.
What twenty seeds say
Thirteen out of twenty is 0.65. Three quarters is 0.75. Timur rightly noticed the shares did not match. But he read too exact a promise into the calculation.
If a smooth seed’s probability is 3/4, the expected number of such seeds among twenty is 20 × 3/4 = 15. This computation needs neither hundreds nor thousands of seeds. Fifteen is the average number of smooth seeds we would expect from repeating such trials many times over. A single handful may hold more or fewer.
A coin makes this familiar. Even with heads and tails equally likely, twenty tosses owe us no exact ten heads. Twelve or eight may come up without exposing any error in what we assumed about the coin. Inherited combinations owe a single handful no strict split by expected shares either.
With conditions unchanged and outcomes independent, in a large enough series a wide stray of the share from 3/4 will be unlikely. That does not mean each next seed must drag us closer to the wanted proportion. And an exact match even a large series does not promise.
We also need to know how our handful was got. Were the seeds picked with no preference for shape? Do they truly come from the plants the scheme describes? Were seeds of one type lost more often than of the other? A large count alone does not settle these questions.
What seven thousand seeds say
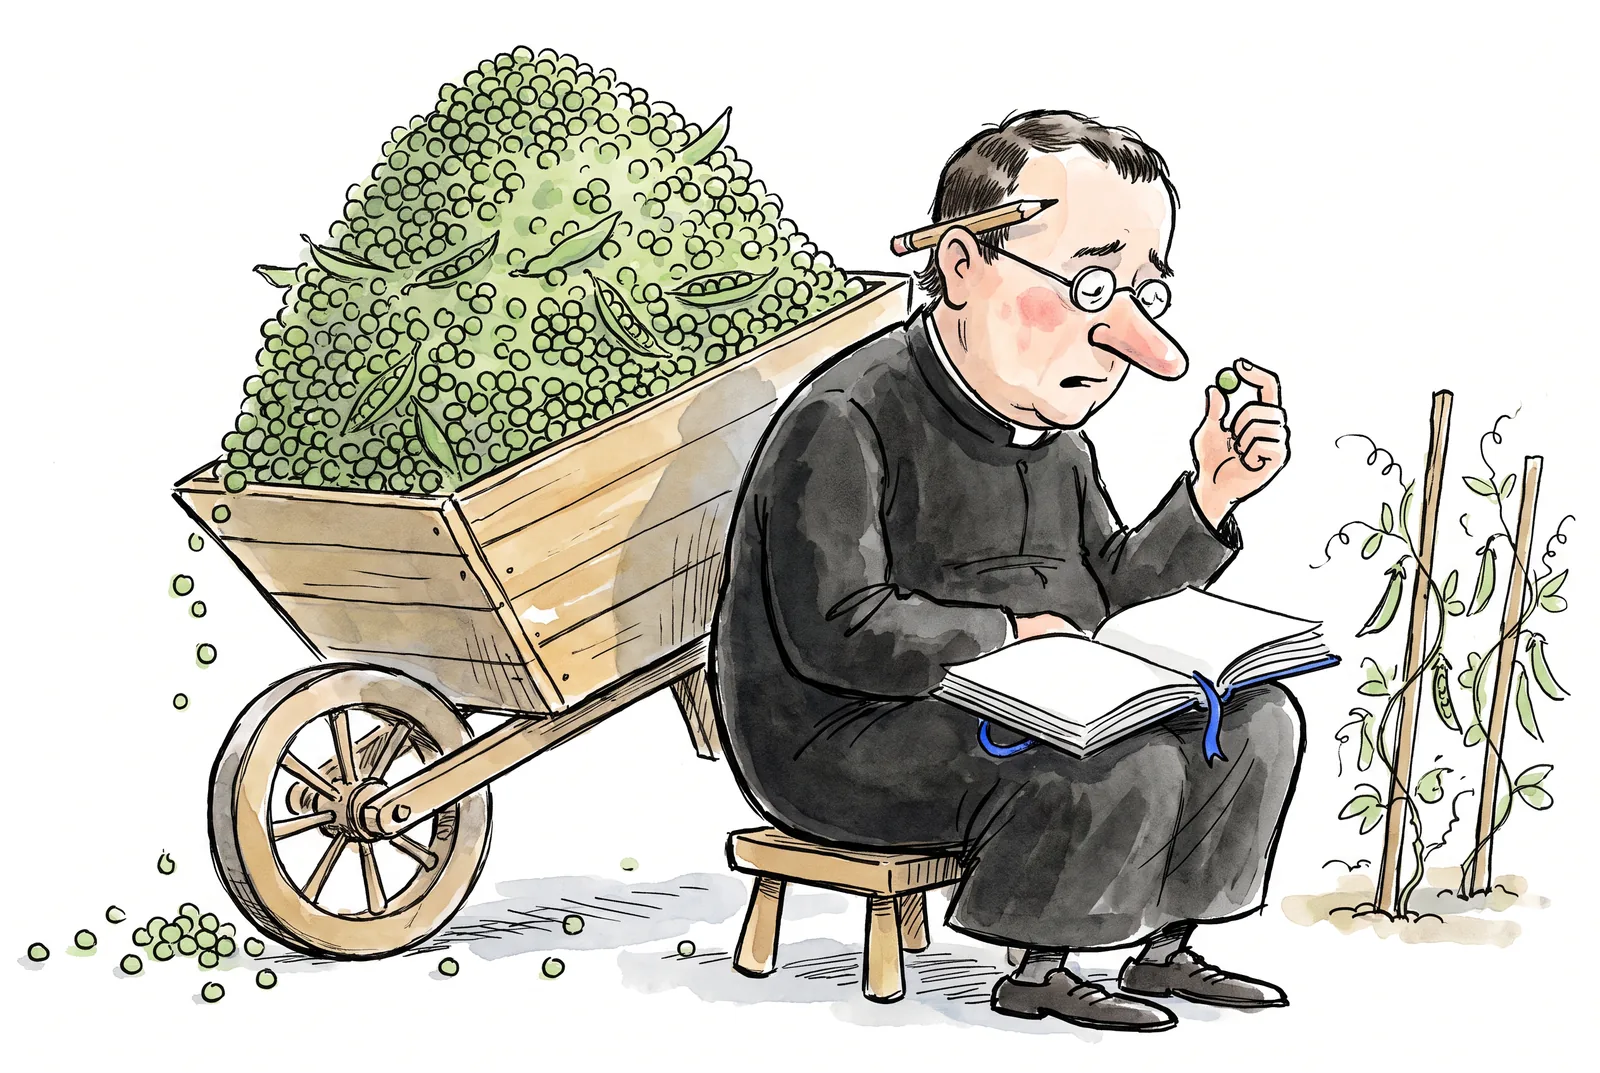
The pattern we are taking apart through the teaching table is known from Gregor Mendel’s experiments. In a paper published in 1866 he described several series of trials with peas. The first series reported concerns seed shape.
From 253 hybrid plants in the experiments’ second year Mendel obtained 7,324 seeds: 5,474 round or rounded — the ones we call smooth here — and 1,850 angular wrinkled ones. The paper states the ratio: 2.96 to one.
Close to three, but still not three.
The round seeds’ share in this series is about 0.7474. Far closer to three quarters than our 0.65, yet no exact match again. The published data keeps this difference. We can repeat the ratio calculation and set it against the theoretical one.
Mendel also reports results for single plants. One yielded 43 round seeds and two wrinkled, another 14 and 15. Inside the large series, single groups differed markedly. The ratio of the whole series set no proportion for each plant.
There is one more detail without which the numbers are hard to check: what exactly counted as a round seed? Mendel specifies that this shape covers seeds with shallow dents too. He writes that he observed no transitional forms in the trials. Such details help another person sort seeds by the same traits. A count’s result depends, among other things, on how clearly the groups we divide the seeds into are described.
Three different meanings of a share
Now three things can be told apart that are easy to take for one.
First — the share of cells in the table: three out of four. That is a counting result. If the table is drawn as we drew it, arithmetic gives exactly 3/4. What remains to check on plants is how well the scheme itself fits our case.
Second — the smooth seed’s probability in the accepted model, also 3/4. It ties the counting to assumptions about inheritance. From it we get the expected share and the expected number of smooth seeds. The expected share is 3/4 for twenty seeds too. The series size moves the probability of the actual share straying from the expected one.
Third — the share got by counting seeds. Dana’s is 13/20, that is 0.65. Mendel’s published series gives 5,474/7,324, about 0.7474. Behind each of these numbers stand particular seeds and a way of picking and sorting them.
A gap between the expected and the obtained share must be judged allowing for the series size and the trial conditions. It may be an ordinary random wobble. Or it may signal that not all conditions hold: some seeds of one type failed to develop, say, or smooth ones were picked more often. A sorting mistake is possible too. The trait may also inherit in a more tangled way than our scheme assumes.
No gap may be declared random in advance. A small sample can also give reason to doubt the model, and a large one will not fix a picking error. Judging how unusual a result is under accepted assumptions takes statistical methods. We will come back to them. For now it is enough to see what must be checked before concluding.
What we know now
Timur expected fifteen smooth seeds and five wrinkled. His expected- count calculation was right. The mistake crept in when he decided that exactly so many must lie on the table.
Dana writes both results into the notebook: the model expects fifteen smooth seeds out of twenty; our handful holds thirteen. Beside them stay questions about the seeds’ origin and the picking conditions. Now it is clear how an observation differs from an expectation, and what grounds each number has.
In the table we check the list of combinations and the count. In the model, the assumptions tying those combinations to inheritance. In the trial, the conditions, the picking of seeds, and the count. That shows where to look for the cause of a gap. One glance at two different shares is not enough for that.
In the first part we asked “how do you know?” of a measurement, a laboratory report, and a teaching table. Each time we had to find out how a number was got and on what conditions it can be trusted. But sometimes disagreement starts even earlier: we mean different things by what we count or name. The second part starts there. First in it comes Pluto.